Crypto Money Flow: Follow the Capital
Track where money is flowing in the crypto market. Identify cryptocurrencies with strong capital inflows before prices make their big moves.
What is Crypto Money Flow?
Money flow analysis is a technique used to measure the amount of capital entering or leaving an asset. In cryptocurrency markets, tracking money flow helps investors identify which coins are attracting the most interest from buyers, often before significant price movements occur.
The fundamental principle is simple: when more money flows into an asset than out, prices tend to rise. Conversely, when capital is exiting an asset, prices typically fall. By monitoring these flows, you can position yourself ahead of major trends rather than chasing price action after the fact.
Our Money Flow indicator analyzes trading volume in relation to price changes and market capitalization. Unlike simple volume metrics, money flow considers the direction of trades – whether buyers or sellers are in control – providing a more nuanced picture of market dynamics.
Components of Our Money Flow Analysis
We combine multiple data points to provide a comprehensive view of capital movements.
Volume/Market Cap Ratio
Measures trading intensity relative to asset size. High ratios indicate strong interest.
Price Momentum
24-hour, 7-day, and 30-day price changes weighted to identify sustainable trends.
Capital Flow Score
Proprietary score combining volume patterns and price action to measure net capital direction.
Opportunity Ranking
Assets ranked by combined flow metrics to highlight the most promising opportunities.
How to Use Money Flow Data
Money flow analysis is most powerful when used as a confirmation tool alongside other indicators. When you see strong money flow into an asset that also has positive momentum and favorable market conditions, the probability of continued upside increases significantly.
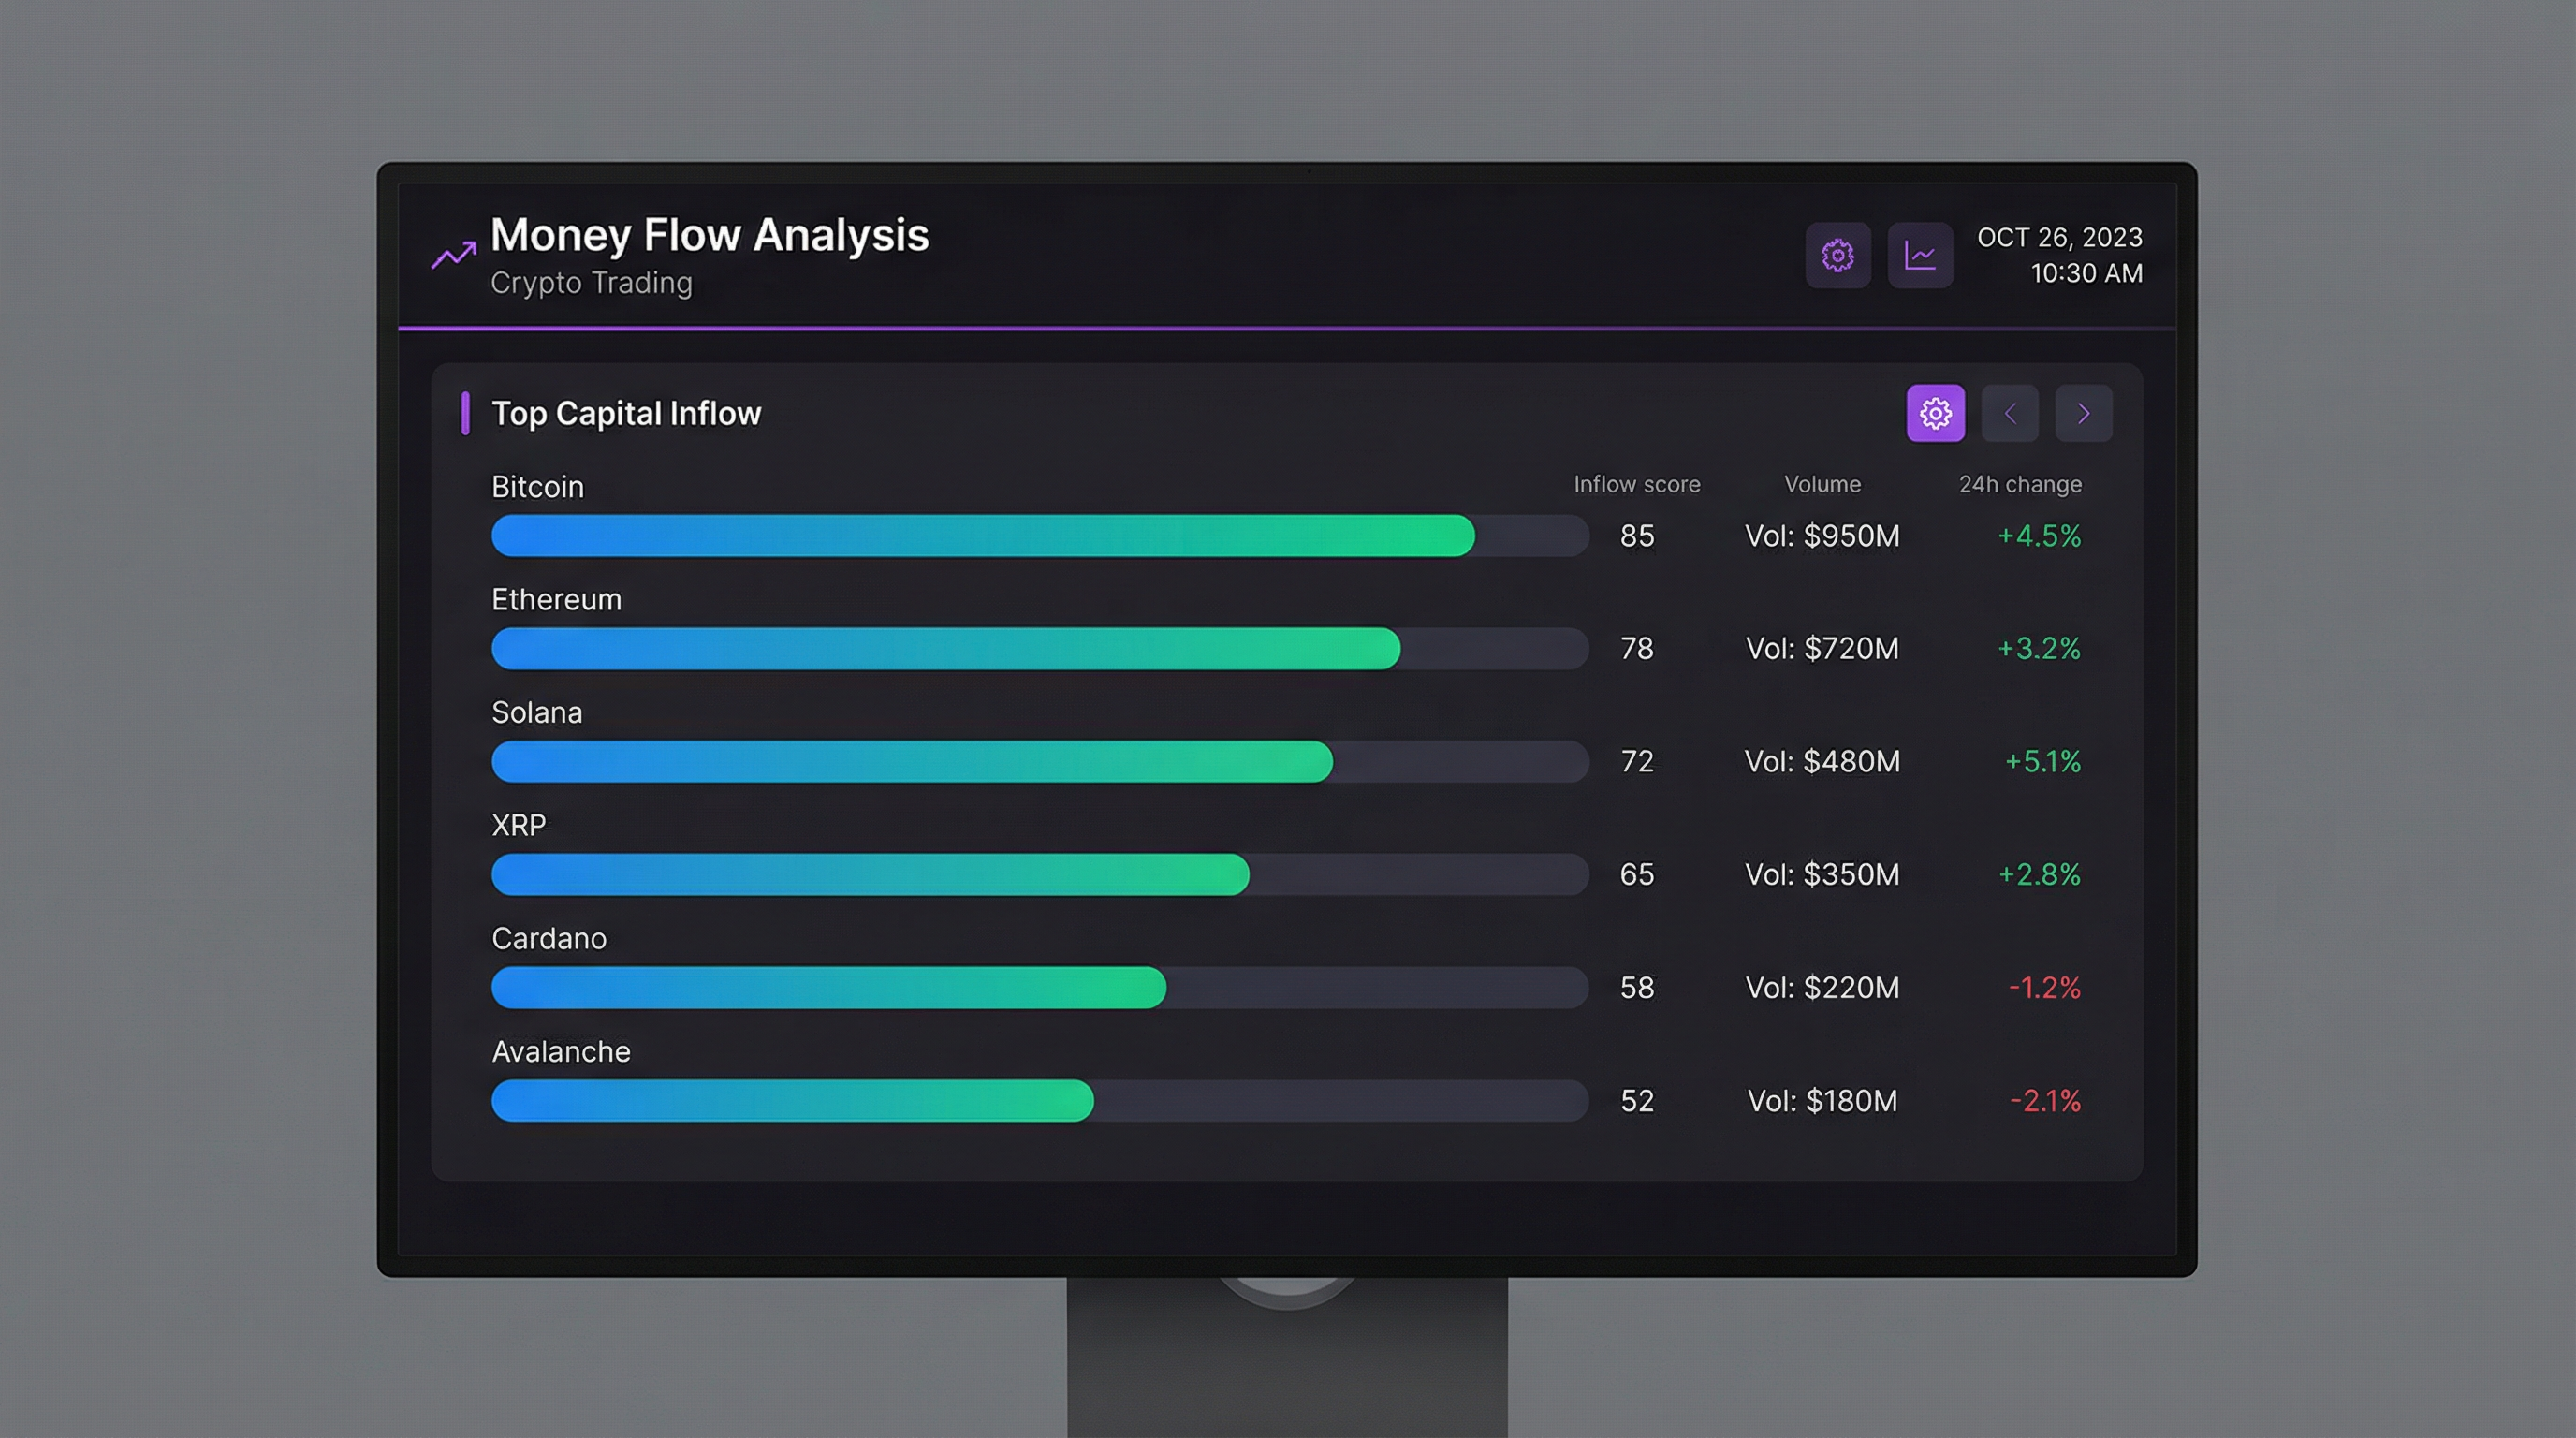
Our dashboard displays the top cryptocurrencies ranked by capital flow score. Each asset shows its flow score, 24-hour trading volume, and recent price change. This allows you to quickly scan the market for assets experiencing unusual capital inflows.
Look for assets where money flow is increasing while price hasn't yet responded dramatically. This divergence often signals that a move is building – capital is accumulating before a breakout. Conversely, if price is rising but money flow is declining, it may indicate the move is losing steam.
It's important to consider market context. During overall bullish conditions, strong money flow is a buying signal. During bear markets, it might indicate short-term relief rallies rather than trend reversals. Always combine money flow with broader market analysis for best results.
Understanding Volume in Crypto Markets
Trading volume is the lifeblood of financial markets, and this is especially true in cryptocurrency. Volume represents the total amount of an asset traded within a given period, and it tells us about the level of interest and conviction behind price movements.
High volume price increases are considered healthy and sustainable – they indicate broad participation and strong buyer conviction. Low volume rallies, on the other hand, are often weak and prone to reversal. Similarly, high volume sell-offs typically signal capitulation and can mark bottoms, while low volume declines may continue until capitulation occurs.
Our money flow analysis goes beyond raw volume by calculating the volume-to-market-cap ratio. This normalization allows fair comparison between large-cap coins like Bitcoin and smaller altcoins. A $1 billion daily volume means different things for Bitcoin ($1 trillion market cap) versus a mid-cap with $500 million market cap.
We also track volume trends over time. Increasing volume over several days often precedes significant price moves. Our system highlights assets where volume is building, giving you early warning of potential opportunities before prices react.
Recognizing Capital Flow Patterns
Experienced traders learn to recognize patterns in capital flow that often precede major market moves. Accumulation phases are characterized by increasing volume on up days and decreasing volume on down days – indicating buyers are absorbing selling pressure.
Distribution phases show the opposite pattern: high volume on down days and low volume on rallies. This suggests large holders are using rallies to exit positions. Recognizing distribution can help you avoid buying into weakness.
In crypto markets, money often flows between sectors. You might see capital rotate from large caps to small caps, from DeFi to gaming tokens, or from layer 1s to layer 2s. Our sector analysis within the Market Intelligence suite helps you track these rotations.
Cross-chain flows are another important pattern. Capital moving from Ethereum to Solana, or from established chains to newer ecosystems, can signal emerging trends. By monitoring where money is flowing across the crypto ecosystem, you can position yourself in growing sectors.
Practical Applications of Money Flow Analysis
For entry timing, look for assets with strong money flow scores that haven't yet experienced significant price appreciation. These represent potential opportunities where capital is building but the move hasn't fully materialized. Our ranking system surfaces these opportunities automatically.
For exit timing, monitor money flow in your existing positions. When an asset you hold shows declining money flow despite price gains, it may be time to take profits. Smart money often exits before price peaks, and you can track this through our flow metrics.
For portfolio construction, consider allocating more to assets with consistently strong money flow scores. Over time, assets that attract capital tend to outperform. Use our money flow rankings as one input in your allocation decisions.
Start Following the Smart Money
Access real-time money flow analysis and identify opportunities before the crowd. Create your free account and start tracking capital movements today.
Create Free Account