Simple Portfolio Tracker for Stocks & Crypto
Stop juggling multiple apps. Track all your investments in one beautiful, intuitive dashboard. Monitor performance, calculate profit/loss, and make informed decisions.
What is a Portfolio Tracker?
A portfolio tracker is an essential tool for any investor who wants to monitor their investments across multiple assets and platforms. Whether you're investing in traditional stocks, cryptocurrencies, or a mix of both, a portfolio tracker consolidates all your holdings into a single, easy-to-use dashboard where you can see your entire financial picture at a glance.
Unlike brokerage platforms that only show assets held within their system, a dedicated portfolio tracker like Portfolio Trading allows you to aggregate investments from multiple sources. This means you can track your Coinbase Bitcoin, your Robinhood stocks, and your Binance altcoins all in one place, giving you a comprehensive view of your total net worth and investment performance.
Modern portfolio trackers go beyond simple balance displays. They provide real-time price updates, calculate your profit and loss automatically, show historical performance through interactive charts, and help you understand your asset allocation. Some advanced features include tax reporting assistance, dividend tracking, and alert notifications when prices reach certain thresholds.
Powerful Features for Smart Investors
Everything you need to track, analyze, and optimize your investment portfolio.
Multi-Asset Support
Track stocks, cryptocurrencies, and ETFs all in one unified dashboard.
Real-Time Quotes
Get live price updates from major exchanges including pre-market and after-hours data.
Performance Analytics
Visualize your portfolio growth with interactive charts and detailed breakdowns.
Profit/Loss Tracking
Automatically calculate your gains, losses, and overall portfolio performance.
Why Choose Portfolio Trading?
Portfolio Trading was built with one goal in mind: to make investment tracking simple and accessible for everyone. We understand that most investors don't need complex trading terminals with overwhelming features. What you need is a clean, intuitive interface that shows you exactly what matters—how your money is performing.
Our platform supports both traditional stocks and cryptocurrencies, recognizing that modern investors often diversify across asset classes. With real-time price data from Yahoo Finance for stocks and CoinGecko for cryptocurrencies, you'll always have accurate, up-to-date information about your holdings.
The transaction logging system is designed for flexibility. You can manually add individual transactions, or use our CSV import feature to bulk upload your trading history from other platforms. Each transaction records the asset, quantity, price, date, and any fees involved, ensuring your profit/loss calculations are precise.
We've also included support for multiple currencies. Whether you prefer to see your portfolio in EUR or USD, you can switch between currencies instantly. The system automatically converts values using live exchange rates, so you always know the true value of your investments in your preferred currency.
Benefits of Using Our Portfolio Tracker
How Portfolio Tracking Works
Getting started with Portfolio Trading takes just minutes. First, create your free account using email or Google sign-in. Once logged in, you can immediately start adding your investments. Simply search for any stock or cryptocurrency, enter the quantity you own, the purchase price, and any transaction fees. The system handles the rest.
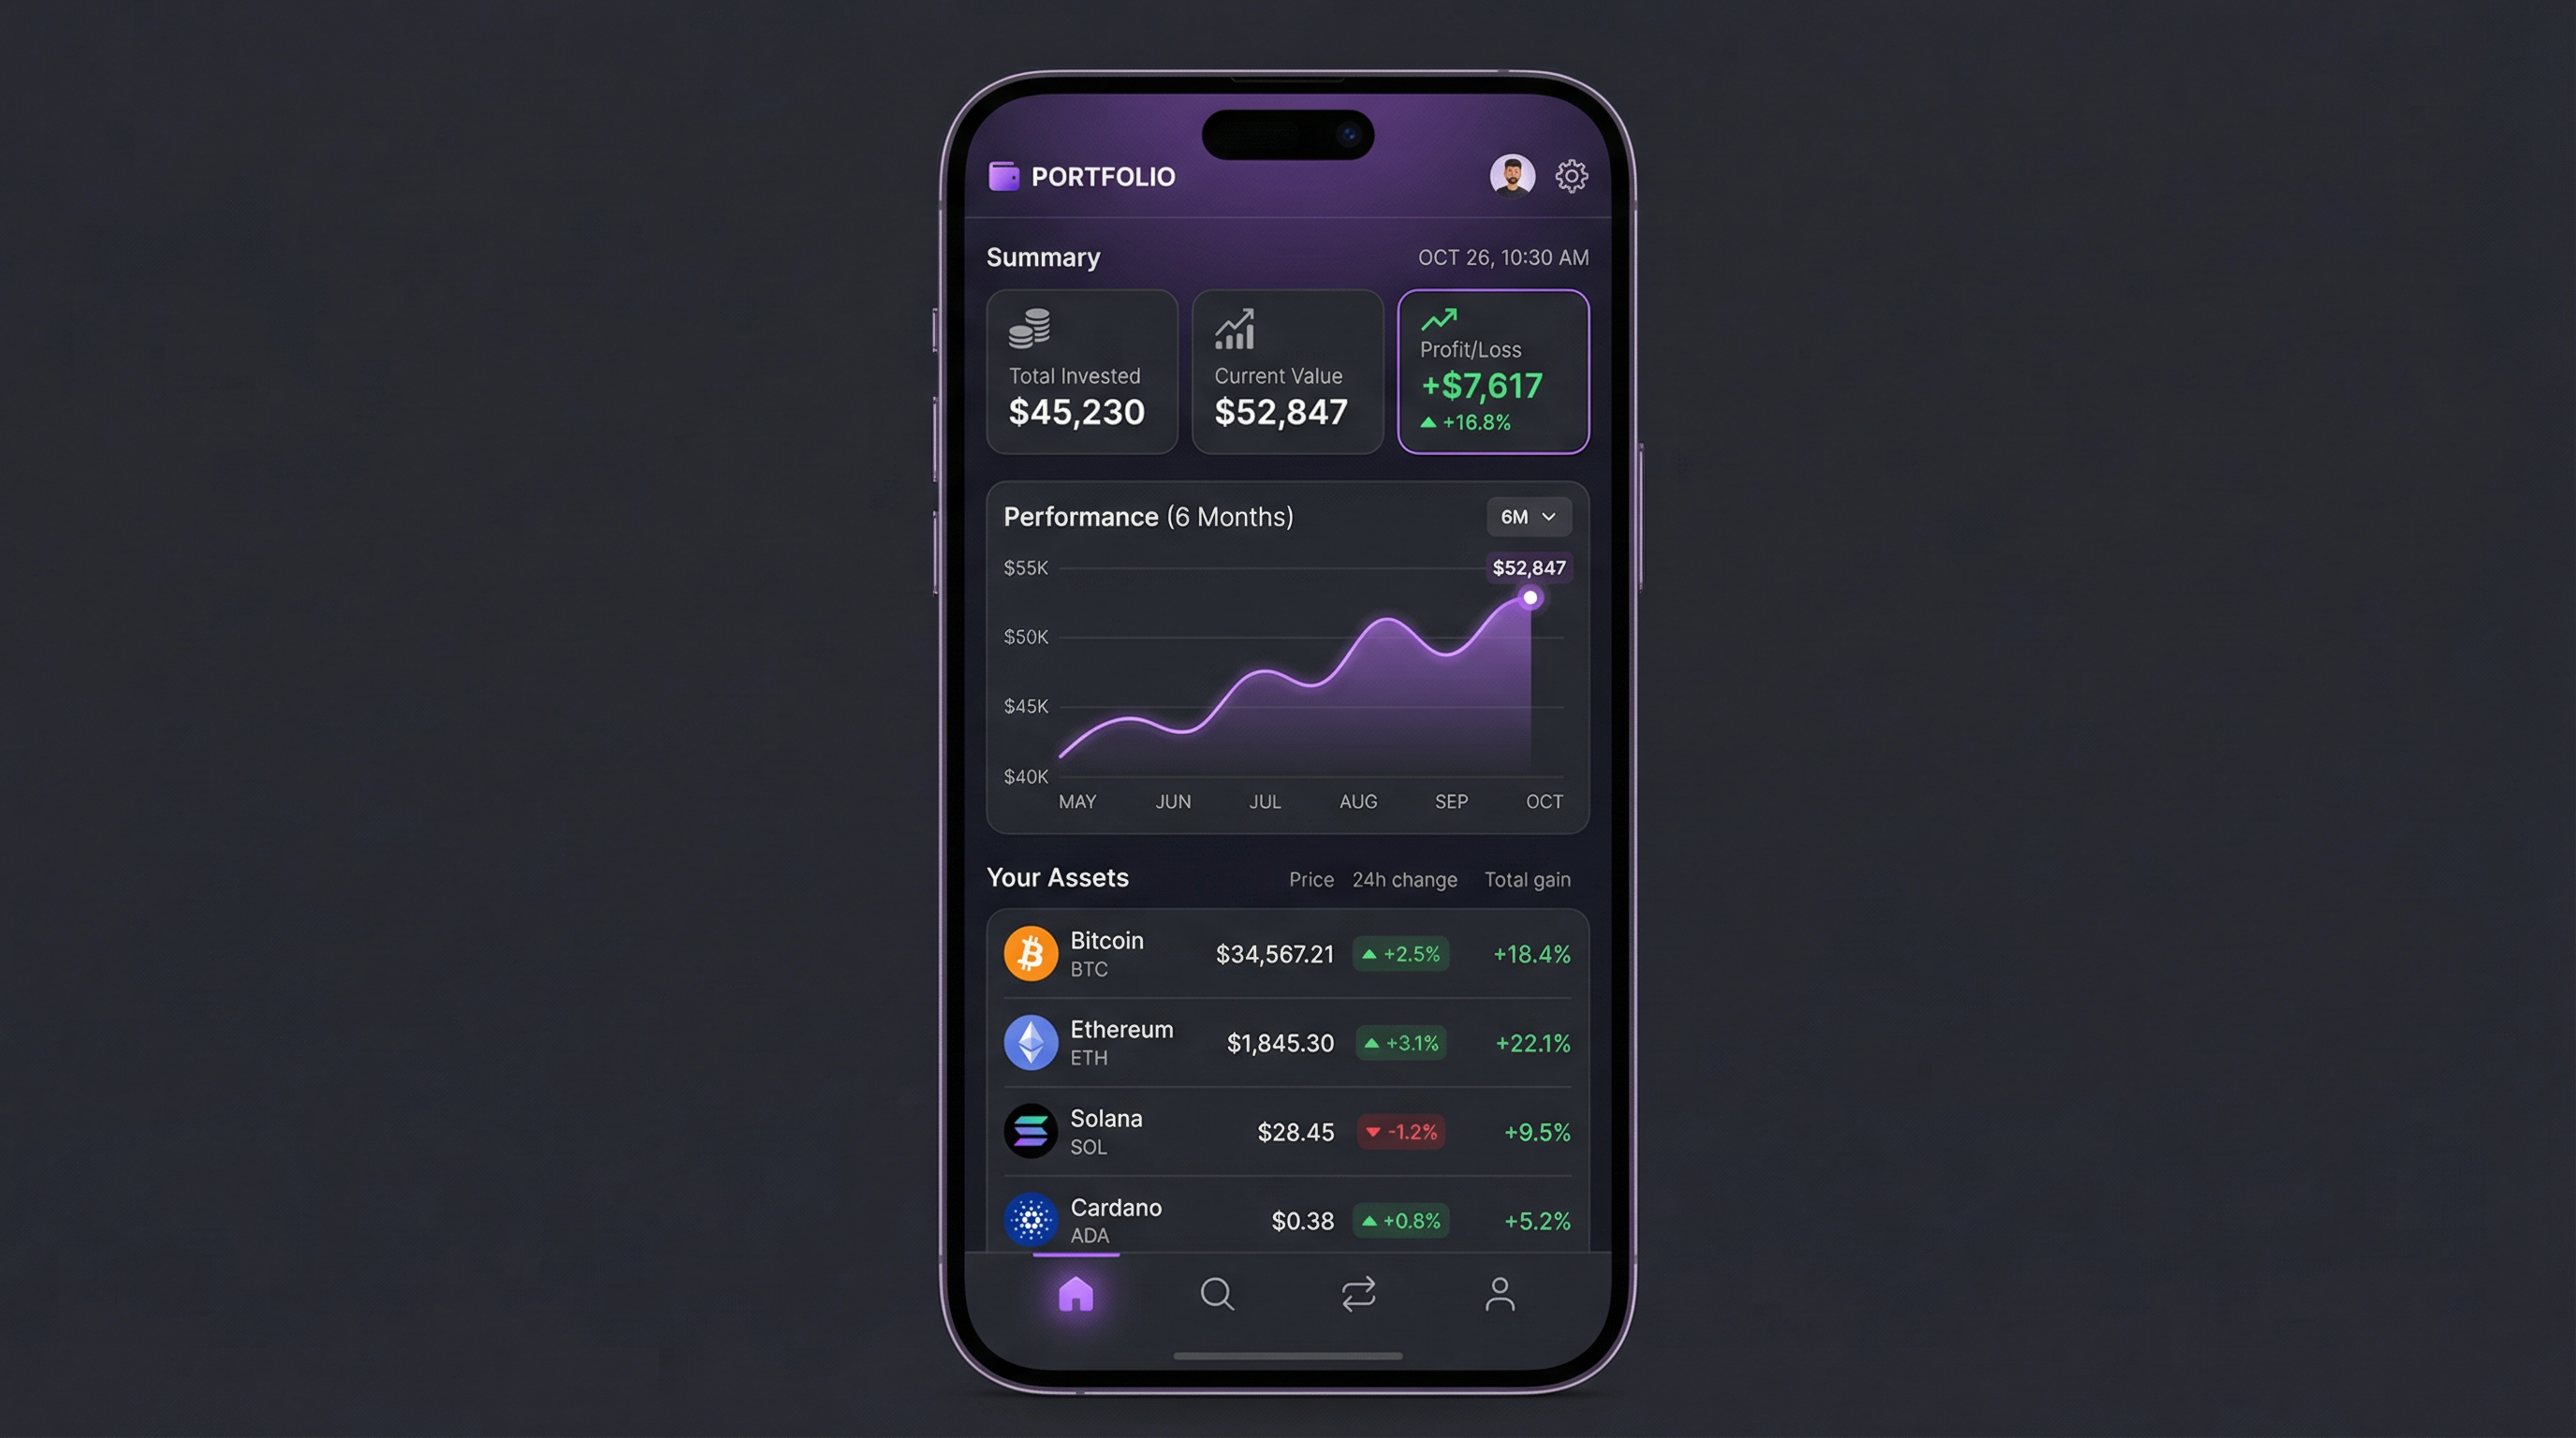
As you add transactions, your dashboard populates with valuable insights. The summary cards show your total invested amount, current portfolio value, and overall profit or loss. The performance chart visualizes how your investments have grown over time, making it easy to spot trends and understand your investment journey.
The positions list provides a detailed breakdown of each asset you hold. You can see the average buy price, current market price, quantity held, and the unrealized gain or loss for each position. For stocks, we even show pre-market and after-hours prices, helping you stay informed about price movements outside regular trading hours.
Ready to Take Control of Your Investments?
Join thousands of investors who trust Portfolio Trading to monitor their portfolios. Start for free today—no credit card required.
Create Free Account